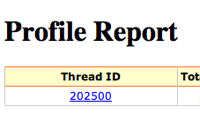
#98 Request Profiling
Mar 24, 2008 | 10 minutes | Performance, Tools
You can use profiling to determine where the performance bottlenecks are in specific Rails actions. Watch this episode for details.
Form Objects
Models have a tendency to become a complex mess as an application grows. In this episode you will learn a couple of techniques to extract form-behavior out into its own class.
(18 minutes)
Batch API Requests
Here I demonstrate how to perform bulk API operations though a single request using Rack middleware. This is great if you need to trigger multiple actions at once such as if the user goes offline.
(18 minutes)
Handling Exceptions (revised)
By default, Rails will render a static error file when an exception occurs in production. Here you will learn how to fully customize this behavior and render dynamic error pages.
(11 minutes)
Performance Testing
Learn how to add performance tests that automate benchmark and profile reports. Here I show how to find the bottlenecks to optimize a page. I also show how to compile Ruby with gcdata to get information about memory usage.
(16 minutes)
Better Errors & RailsPanel
Here we take a look at two tools to aid us in development: Better Errors which makes it easier than ever to debug exceptions, and RailsPanel, a Chrome extension to see Rails requests.
(8 minutes)


