#411 Performance Testing pro
- Download:
- source codeProject Files in Zip (67.9 KB)
- mp4Full Size H.264 Video (46.7 MB)
- m4vSmaller H.264 Video (24.2 MB)
- webmFull Size VP8 Video (22.8 MB)
- ogvFull Size Theora Video (68.9 MB)
There are a variety of tools available to help find performance bottlenecks in Rails applications, such as MiniProfiler which was covered in episode 368. One problem with these is that once we’ve finished optimizing we usually put the profiling tools away even though performance issues can crop up again as we make changes to an application. This is where performance testing comes in handy. We can use this to help us automate benchmarking and profiling throughout our app and we’ll be using it in the episode with the page shown below. This displays a list of products and as it’s a popular page on our site we want it to perform as well as possible.

If we look in the test directory of a new Rails 3 app we’ll find a performance directory which contains an example performance test. Rails 4 apps don’t have this directory as performance testing has been extracted out into a separate gem called rails-perftest which needs to be added to the app’s gemfile. The README for this gem is a great resource and goes through the various options that we can use.
Let’s go back to our Rails 3 application and take a look at the generated performance test.
require 'test_helper'
require 'rails/performance_test_help'

class BrowsingTest < ActionDispatch::PerformanceTest
  # Refer to the documentation for all available options
  # self.profile_options = { :runs => 5, :metrics => [:wall_time, :memory]
  #                          :output => 'tmp/performance', :formats => [:flat] }

  def test_homepage
    get '/'
  end
end
This class inherits from ActionDispatch::PerformanceTest which in turn inherits from the integration testing. This means that we can do anything in this test that we can do in an integration test including simulating web requests and this is what test_homepage does. This method fetches the home page, although it doesn’t make any assertions and doesn’t verify any data or that our home page is rendered correctly. Performance tests aren’t designed to test the validity of our application but are just there to test the performance. Let’s try running this one test and see what happens. Running rake test runs our test suite but this doesn’t include the performance tests. There are a couple of other commands that are designed for this. One is test:benchmark but if we run this we’ll see an error telling us that we need to add the ruby-prof gem to our application. We’ll do that now and add it just to the test group and running bundle to install it.
gem 'ruby-prof', group: :test
If we try running rake test:benchmark now we might get a different error telling us that the --benchmark option can’t be found. This happens because we’re not using the full version of Test::Unit. As our application is running on Ruby 1.9 it’s using MiniTest so we’ll need to add the test-unit gem to our gemfile, too.
gem 'ruby-prof', group: :test
gem 'test-unit', group: :test
This time when we run our benchmark command we should see some output.
$ rake test:benchmark
Loaded suite /Users/eifion/.rbenv/versions/1.9.3-p194/lib/ruby/gems/1.9.1/gems/rake-10.0.3/lib/rake/rake_test_loader
Started
BrowsingTest#test_homepage (140 ms warmup)
           wall_time: 42 ms
              memory: unsupported
             objects: unsupported
             gc_runs: 0
             gc_time: 0 ms
.

Finished in 1.246379 seconds.

5 tests, 0 assertions, 0 failures, 0 errors, 0 pendings, 0 omissions, 0 notifications
0% passed

4.01 tests/s, 0.00 assertions/s
Here we can see the wall time for the home page test and some other results such as memory and objects, although these are currently unsupported by our version of Ruby. Later on we’ll show how to add support for these options but for now we’ll focus on the wall time. This tells us how long the page took to render and respond and while the number displayed may not be that useful in itself it becomes useful when we compare it with results from other builds or changes that we’ve made. This is why every time we run the benchmark command the results are recorded in a CSV file. We’ll find this file in the tmp/performance directory and it contains such information as the time the test took to run, when the test was run and the version of Ruby and Rails that it was run on.
We’ll make a change to our Rails app now to see how if affects the tests. We’ll add some eager loading to the action that loads the products, like we showed in episode 22. As we’re displaying the category name on the page this should have an effect on performance.
def index
  @products = Product.order("name").includes(:category)
end
When we run the benchmark command now the time taken to run as been reduced by about a third. This new test will also have been added to our CSV file and we’ll be able to use this to track how the performance of the page changes over time.
It’s difficult to remember to run this command manually every time we make a change. We could automate it by, say, adding it to a Git commit hook or to a continuous integration server setup. We won’t do that here, though, as it’s a little out of the scope of this episode.
Diving Deeper
After we’ve gathered enough data we can import it into something like Google Spreadsheets which allows us to easily chart it so that we can see how the performance changes over time. There are other tools, such as New Relic, which provide similar information but it’s nice to have it on our local machine so that we can analyse the changes before we deploy them to our application. After we’ve determined that there’s a performance issue with a request we might want to dive deeper and one way to do this is to use the other Rake task that’s provided test:profile. This command takes a longer to run and it returns a longer time, but this is because the processor takes longer to process the request.
$ rake test:profile
Loaded suite /Users/eifion/.rbenv/versions/1.9.3-p194/lib/ruby/gems/1.9.1/gems/rake-10.0.3/lib/rake/rake_test_loader
Started
BrowsingTest#test_homepage (123 ms warmup)
        process_time: 225 ms
              memory: 0 Bytes
             objects: 0
.

Finished in 5.775874 seconds.

3 tests, 0 assertions, 0 failures, 0 errors, 0 pendings, 0 omissions, 0 notifications
0% passed

0.52 tests/s, 0.00 assertions/s
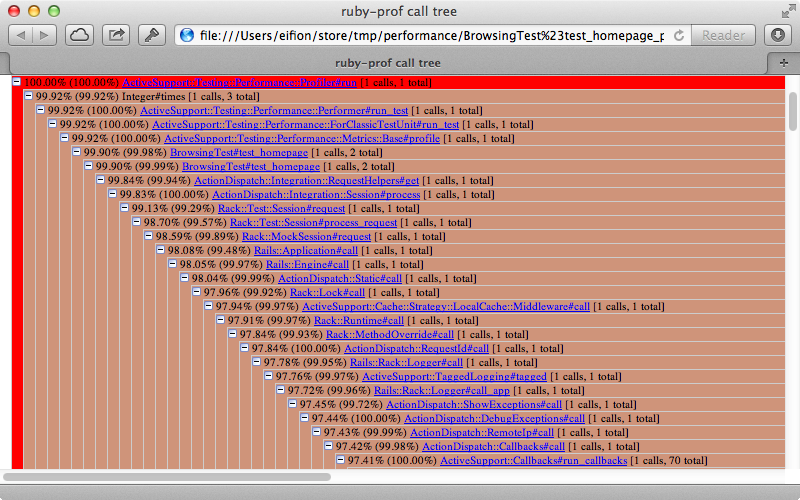
The output from this command isn’t very helpful but there are several files that this command has generated in the tmp/performance directory. These are in several formats; we’ll take a look at the Process Time Stack file in HTML first. This gives us an overview of the various methods that were called in order to process the home page and the amount of time that each of them took.

It’s difficult to see all that’s going on here but it starts with a call to Profiler#run and then goes through each method that’s called. The number on the left of each row tells us the total percentage that was taken up at that point in the call while the number in parentheses tells us how much percentage of the parents’ call that this method took up. In this list we’ll find the call to the ProductsController’s index action and from this point on it takes up about 92% of the total amount of time that we’re profiling. The other 8% is mostly taken up with Rack middleware.
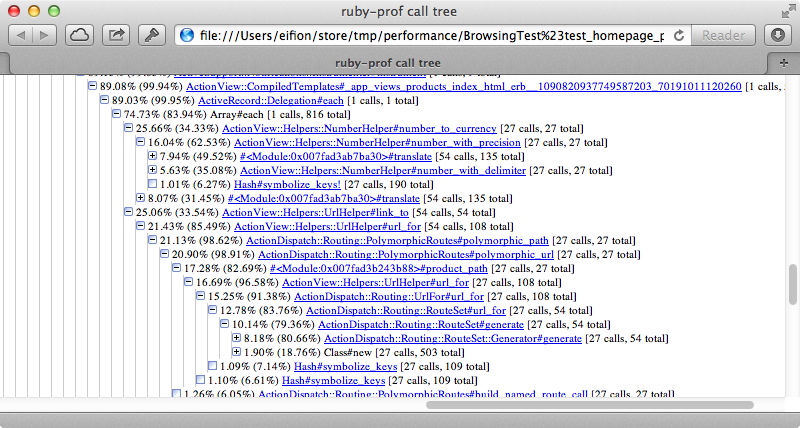
If we dive a little deeper into this list things start to get more interesting. The events below all happen during the rendering of the erb template and we’ll see some familiar methods listed here, such as number_to_currency which is called 27 times in the view template. This takes up around 25% of the total time of the total request which is quite a lot to convert a decimal value to a currency. A lot of this time is spent doing the internationalization and translation so if we don’t need this then we could consider optimizing this and converting the price a different way.

Further down we can we that the ActionRecord::Relation#to_a which is what triggers the database query and which takes up about 14% of the total time. This shows that we could spend a lot of time optimizing our database query not realizing that it’s the view and helper methods that take up most of the time. This is enlightening as it shows that the slow parts of the code aren’t always where we expect them to be.
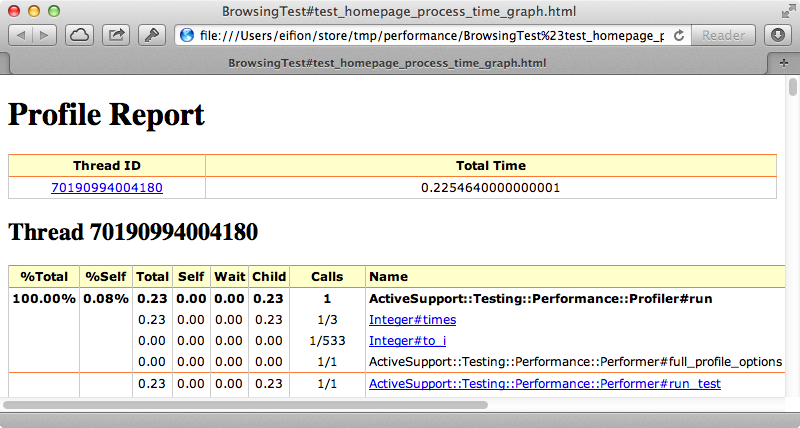
If we find that the stack file doesn’t give us enough details we can look at the graph file instead. It’s easy to feel a little overwhelmed when we open this file as there’s a lot of information here but once we learn how to read it it’s not too bad. This file contains a large table that’s divided up into sections. Each section represents a method and the method name is in bold at the top.

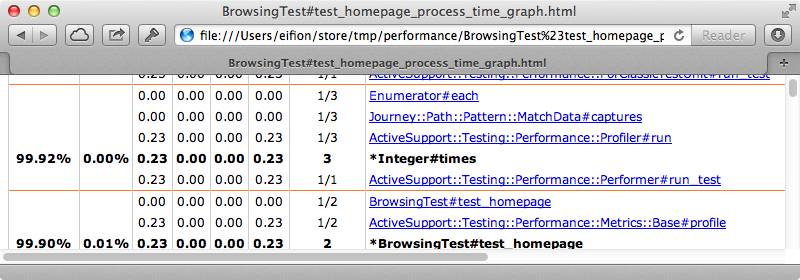
The top method is the one that the profiler calls so it’s shown as taking up 100% of the time, although the “self” column next to it shows that the method itself takes up very little of the total time. The lines below the top one show the child methods that are called and we can see the time that’s spent in these, too. Most of the time in spent in Integer#times and if we click that we’ll be taken to the part of the table that shows that method and its child methods.

This section has Integer#times towards the bottom. Every entry above this is one of the parent methods that called it while the those below are the children. Again we can click on each entry to walk through the different methods that are called and it’s a good idea to find each method that takes the longest time to run and to click on it to see the section for it. By doing this we’re walking through the stack similar to how we did it in the previous report. Rails request stacks are ridiculously large so it’s best to use the browser’s search functionality to find to look for the code we want to focus on. If we use this to find number_to_currency we’ll see the same statistics as before but now we can drill down to its child methods to see which one takes up the most time and even into the methods that Rails uses if we want to try optimizing it.
Overall this report is really handy if we want to delve into exactly what each method does and how much time it takes but in general it’s better to work with the stack HTML report that we dealt with earlier and to only use the profile report on the occasions when we need that much detail.
Better Simulating The Production Environment
Whenever we test performance we need to ask ourselves how our environment differs from the application’s production environment. In general the development and testing environments are quite a bit different from production but in performance tests there are some changes made to make it more similar. These happen within the rails/performance_test_help file so let’s take a look at it.
require 'action_controller/performance_test'

ActionController::Base.perform_caching = true
ActiveSupport::Dependencies.mechanism = :require
Rails.logger.level = ActiveSupport::BufferedLogger::INFO
This file is fairly simple. The first line enables caching, which is definitely something we want to simulate production. The next line changes the dependency mechanism to :require which will make sure that it doesn’t reload the files on each request like it would on development. The final line sets the log level to INFO instead of DEBUG as this can affect performance. This file does a decent job of simulating production but if we need to do something more extensive we could copy this into a separate file in our Rails app and load it directly instead of relying on this file.
Another common difference with production is the contents of the database. There is often more data in the production database and this will definitely play a part in how profiling and performance tuning work. In our application we’ve added a lot of data through the fixtures so that we have a database nearer to the production one. That said, fixtures can be fairly clunky and aren’t really practical for adding a large number of records. Instead we could set up a different database specifically for performance testing. This blog post shows how to do that, although it’s a little out of date so it’s better to use this gist for the file that we load into our test environment.
Viewing Memory and Object Usage
The next thing we’ll cover is how to add support for the memory and objects report when we run the test :benchmark command. To do this we need to patch the garbage collector in our version of Ruby. There are some instructions on how to do this within the rails-perftest README. If you’re using RVM you can set this up with a single command to install Ruby with the patch included or alternatively you can compile it from source. If you’re using rbenv with ruby-build you can use this installer definition file to install Ruby 1.9.3 with the garbage collection data patch.
# from https://github.com/sstephenson/ruby-build/pull/327
[ -n "$CC" ] || export CC=cc

before_install_package() {
  if [ "$1" = "ruby-1.9.3-p125" ]
  then
    local patch_url="https://raw.github.com/wayneeseguin/rvm/master/patches/ruby/1.9.3/p125/gcdata.patch"

    echo "Applying garbage collection data patch..."
    echo "-> $patch_url"

    curl --silent $patch_url | patch --silent -p1
  fi
}

install_package "yaml-0.1.4" "http://pyyaml.org/download/libyaml/yaml-0.1.4.tar.gz#36c852831d02cf90508c29852361d01b"
install_package "ruby-1.9.3-p125" "http://ftp.ruby-lang.org/pub/ruby/1.9/ruby-1.9.3-p125.tar.gz#e3ea86b9d3fc2d3ec867f66969ae3b92"
install_package "rubygems-1.8.23" "http://production.cf.rubygems.org/rubygems/rubygems-1.8.23.tgz#178b0ebae78dbb46963c51ad29bb6bd9" ruby
All we need to do is call rbenv install and pass it the path to this file. This will install a version of Ruby with that patch applied. Once it has installed we can switch to that version and then install Bundler.
$ rbenv install ruby-1.9.3-p125-gcdata
$ rbenv shell ruby-1.9.3-p125-gcdata
$ gem install bundler
Next we’ll need to switch to our Rails app’s directory and run bundle install to install the gems it needs. When it finishes we can run rake test:benchmark again. This time it will report the memory usage and number of objects.
$ rake test:benchmark
Loaded suite /Users/eifion/.rbenv/versions/ruby-1.9.3-p125-gcdata/lib/ruby/gems/1.9.1/gems/rake-10.0.3/lib/rake/rake_test_loader
Started
BrowsingTest#test_homepage (179 ms warmup)
           wall_time: 27 ms
              memory: 920 KB
             objects: 15,350
             gc_runs: 0
             gc_time: 0 ms
.

Finished in 1.433101 seconds.

5 tests, 0 assertions, 0 failures, 0 errors, 0 pendings, 0 omissions, 0 notifications
0% passed

3.49 tests/s, 0.00 assertions/s
This is really key: in a production setup we want to keep the memory usage as low as possible and performance can be affected if there are too many objects and they need to be garbage-collected. These numbers will be tracked in separate CSV files automatically which is really handy as it means that we can keep an eye on them and see if we’ve made a change that increases the memory usage substantially or causes other issues.
Optimizing The Page
We’re pretty much done performance-testing our home page so let’s apply what we’ve learned and see how much we can optimize it. Here’s the index template. where most of the processing time is spent.
<h1>Products</h1>

<table id="products">
  <tr>
    <th>Product Name</th>
    <th>Category</th>
    <th>Price</th>
  </tr>
<% @products.each do |product| %>
  <tr>
    <td><%= link_to product.name, product %></td>
    <td><%= product.category.name if product.category %></td>
    <td class="price"><%= number_to_currency(product.price) %></td>
    <td><%= link_to "edit", edit_product_path(product) %></td>
  </tr>
<% end %>
</table>
We know that number_to_currency takes up a lot of the processing time so we’ll replace it with something else. We also know that calculating the paths is slow so we’ll change these, too.
<% @products.each do |product| %>
  <tr>
    <td><%= link_to product.name, "/products/#{product.to_param}" %></td>
    <td><%= product.category.name if product.category %></td>
    <td class="price"><%= "$%.2f" % product.price %></td>
    <td><%= link_to "edit", "/products/#{product.to_param}/edit" %></td>
  </tr>
<% end %>
If we run the benchmarks again now we’ll see quite a change in the memory use and number of objects.
wall_time: 11 ms
   memory: 200 KB
  objects: 3,126
  gc_runs: 0
  gc_time: 0 ms.
The wall time is now less than half as long and the memory and number of objects used has gone down even more significantly just by making a few changes to the template. We could jump to caching the view template in a normal situation but by profiling the results we could find the bottlenecks and avoid caching by just making a few small changes. It’s always wise to not fall into the trap of premature optimization and assume that it’s always Rails’ helper methods that are making the views slow. We should always profile each situation to find where the bottlenecks are as they can be different in each scenario.
Even though we’ve just been testing on one page it’s always a good idea to work out which of your applications’ pages are receiving the most traffic and which it would be most beneficial to optimize. We can then add performance tests for each of these pages. Also we’re not limited to testing requests. We can call ActiveRecord methods directly from a test to benchmark specific bits of code.
Finally it’s worth noting that we can pass in additional options to customize the output but the defaults are generally good enough on their own. To learn more about the supported options take a look at the rails-perftest README.


