#378 FnordMetric
FnordMetric allows us to track and chart events, such as user activity, in realtime in a Rails application. It has a clean interface and allows us to easily browse the charts it generates. In this episode we’ll show you the basics of getting it set up and integrated with a Rails app.
Getting Started With FnordMetric
FnordMetric uses Redis to store its events so we’ll first need to install that. If you’re running OS X this is most easily done through Homebrew.
$ brew install redis
Once this has installed we can start it up by running this command:
$ redis-server /usr/local/etc/redis.conf
Now that we have Redis up and running we’ll set up FnordMetric using an example provided in its README. At the time of writing there appear to be some issues with the simple example on this page so we’ll use the full example instead. We’ll create a new Ruby file called fnordmetric.rb and paste the code from this example into it. This is too long to show here, but can be seen on Github. Before we can run it we’ll need to install the FnordMetric gem. We can then run the example script.
$ gem install fnordmetric
$ ruby fnordmetric.rb
>> Thin web server (v1.3.1 codename Triple Espresso)
>> Maximum connections set to 1024
>> Listening on 0.0.0.0:4242, CTRL+C to stop
[12-09-26 17:54:46] listening on http://0.0.0.0:4242
[12-09-26 17:54:46] listening on tcp://0.0.0.0:2323
[12-09-26 17:54:46] worker started
When run this script it will start listening on a couple of different ports. Its Web application will start listening on port 4242 while we can post new events to port 2323. If we go to localhost:4242 we’ll see the Web interface which will show charts for various events. The data for these charts is generated by the script and the charts update in realtime. Clicking the links in the left panel will show other charts and we’ll see examples of these later.
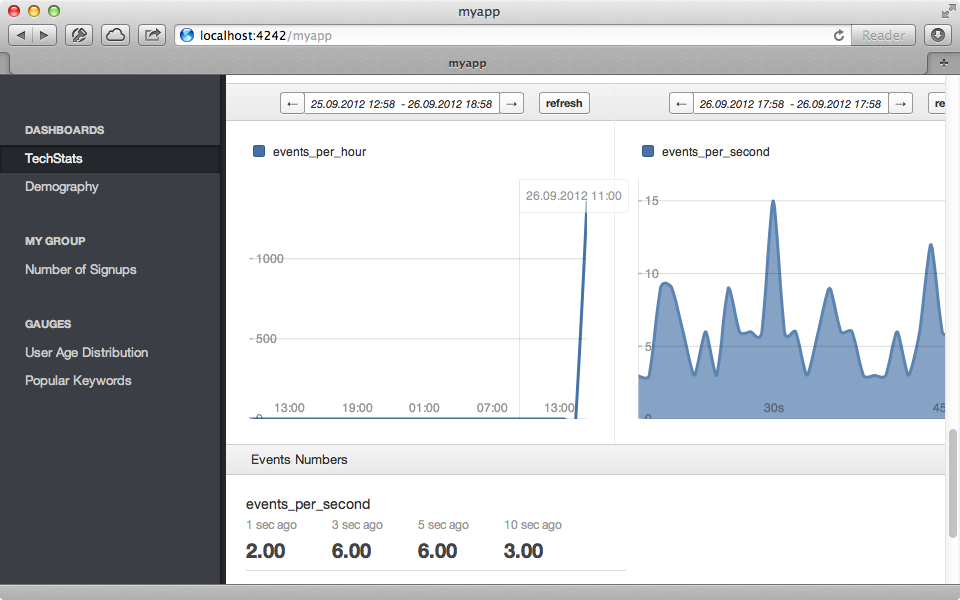
If we look at some of the code in this script we’ll see the DSL that’s provided for defining the gauges that appear in the UI. To create an event we call event and pass it a block. FnordMetric will then listen to this event and update the chart as determined by the code in the block.
event :search do
  observe :popular_keywords, data[:keyword]
endTowards the bottom of this script we can see how the events are populated.

 fnordmetric.rb
def start_example_data_generator

  api = FnordMetric::API.new
  Thread.new do
    loop do
      api.event(:_type => :signup, :referrer => (rand(3) == 1 ? :twitter : :facebook))
      api.event(:_type => :search, :keyword => (%w(Donau Dampf Schiff Fahrts Kaptitaens Muetzen Staender).shuffle[0..2] * ""))
      api.event(:_type => :user_demography, :age => rand(15..85), :gender => (rand(2)==1 ? :female : :male) )
      sleep (rand(10)/10.to_f)
    end
  end
end
Here we create a new instance of the FnordMetric::API class and call event on it to fire an event. We pass this a _type, which is one of the types we’ve defined with event, and any other attributes that we want to send. The code here repeatedly lops through these events and calls them at random intervals.
Adding FnordMetric to a Rails Application
Now that we understand the basics of how FnordMetric works we’ll see what’s involved in integrating it into a simple Rails application that handles a list of products.
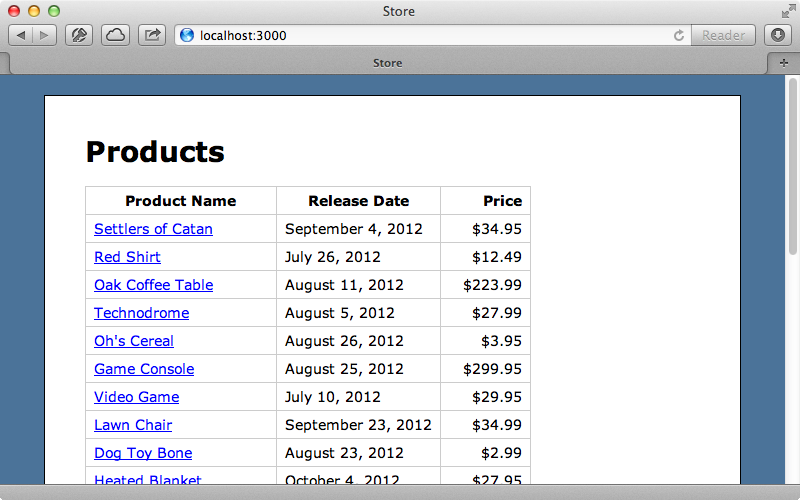
We want to track how often each product’s page is viewed. When this happens we’ll send an event to FnordMetric so that we can display this information in various charts. To start we’ll need to add the fnordmetric gem to the gemfile and run bundle to install it.
gem 'fnordmetric'Next we’ll create a new initializer file where we can set up FnordMetric. All we need to do is create a new instance of FnordMetric::API and assign it to a constant so that we can access it anywhere in our Rails application.
FNORD_METRIC = FnordMetric::API.new
This will open a new connection to the Redis database and will insert events into it directly. This is more efficient than adding events through port 2323. Next we’ll trigger an event inside the ProductsController’s show action which is the page that displays information about a single product.
def show
 @product = Product.find(params[:id])
   FNORD_METRIC.event(@product.attributes.merge(_type: :view_product))
end
To trigger the event we call FNORD_METRIC.event and pass the parameters we want to pass in, in this case the product’s attributes. It’s important that we also pass in a _type attribute so that we can give the event a name. Whenever we visit a product’s page now it will add an event to Redis. Next we need to set up a Fnord app to listen to this event and adjust any of the gauges and we’ll create a Ruby script at the root of our application to do this.
require "fnordmetric"

FnordMetric.namespace :store do
  toplist_gauge :popular_products, title: "Popular Products"

  event :view_product do
    observe :popular_products, data[:name]
  end
end

FnordMetric::Web.new(port: 4242)
FnordMetric::Worker.new
FnordMetric.run
Here we require fnordmetric and then define a namespace called store where we can define our gauges. We then start up a Web and a Worker. Note that we don’t start an acceptor as we’ll be adding events directly into Redis. There are several types of gauges that can be used and we’ve used a toplist_gauge where we show the popular products. We then make a new event listener that listens to the view_product event. This observes the popular_products gauge that we’ve just set up and which we pass the name of the product through the data hash which contains the product’s attributes that we passed in in the controller.
We can now start up our FnordMetric app by running ruby fnordmetric_app.rb and then view our gauge in the browser. When we do this we get a blank page as no events have come in yet. If we visit some of the products’ pages in the browser then click “Popular Products” in the left panel we’ll see the products that we viewed.
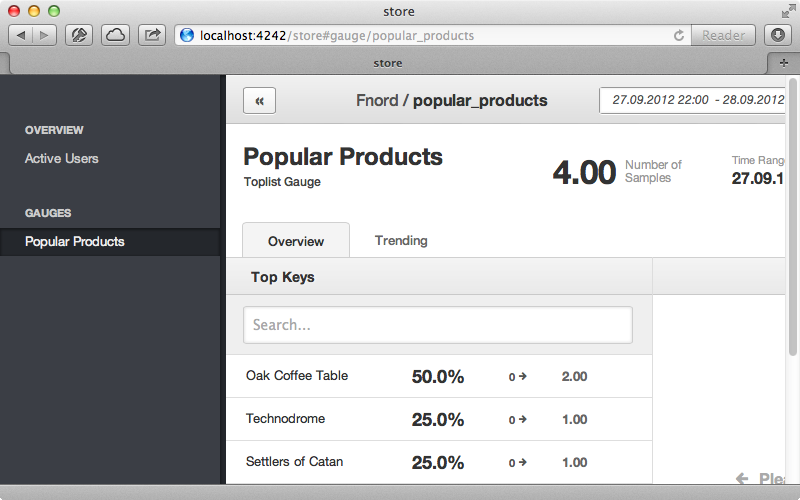
Manually triggering these events is a bit of a pain so we’ll set up a Rake task that will do this for us to simulate real-world activity. Before we do this we’ll move the FnordMetric event trigger from the controller into the Product model. This will clean up the controller a little and allow us to trigger the event from our Rake task. We’ll create a new method called trigger_view_event in the model and call that from the controller.
def show
  @product = Product.find(params[:id])
  @product.trigger_view_event
end
Next we’ll write this new method in the model.
def trigger_view_event
  FNORD_METRIC.event(attributes.merge(_type: :view_product))
end
Now we can write our Rake task.
namespace :fnordmetric do
  desc "Populate FnordMetric with events to simulate user activity"
  task :populate => :environment do
    products = Product.all
    loop do
      products.sample.trigger_view_event
      sleep(rand)
    end
  end
end
This is a simple Rake task which loads in the Rails environment then repeatedly triggers the view event for that product, sleeping for a random time between zero and one seconds. We can start our Rake task now and it will run in the background.
$ rake fnordmetric:populate
If we refresh our gauge now we’ll see a lot more events registered and see which products are becoming more or less popular.
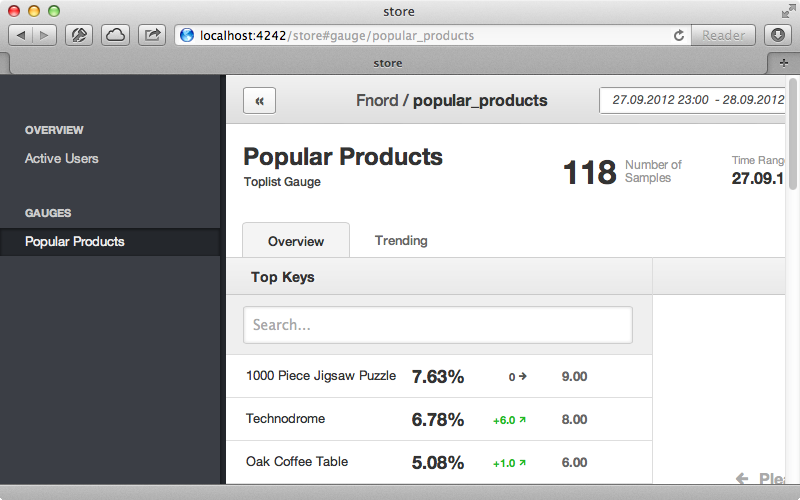
Next we’ll add another gauge to see which price ranges are the most popular. This is done by adding a distribution_gauge which we pass a title and an array of ranges. We’ll need to observe this gauge, too.
require "fnordmetric"

FnordMetric.namespace :store do
  hide_active_users

  toplist_gauge :popular_products, title: "Popular Products"

  distribution_gauge :popular_prices, title: "Popular Prices",
    value_ranges: [0..5, 5..10, 10..20, 20..50, 50..10000]

  event :view_product do
    observe :popular_products, data[:name]
    observe :popular_prices, data[:price]
  end
end

FnordMetric::Web.new(port: 4242)
FnordMetric::Worker.new
FnordMetric.run
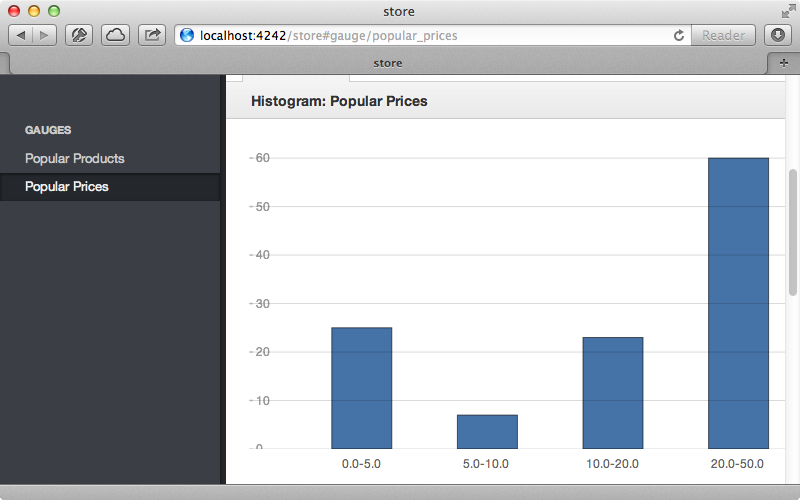
We’ve also added a call to hide_active_users in this file. This will remove the Active Users menu option from the left panel as this isn’t that useful to us. We’ll need to stop and restart this script as we’ve changed it but after we have we’ll see the new “Popular Prices” graph listed and clicking it will show the most popular price ranges based how often each product has been visited.
We’ll add a final gauge to our list showing the number of product views per second.
FnordMetric.namespace :store do
  hide_active_users

  toplist_gauge :popular_products, title: "Popular Products"

  distribution_gauge :popular_prices, title: "Popular Prices",
    value_ranges: [0..5, 5..10, 10..20, 20..50, 50..10000]

  gauge :product_views_per_second, tick: 1.second
  widget "Product Views",
    title: "Views per Second",
    type: :timeline,
    width: 100,
    gauges: :product_views_per_second,
    include_current: true,
    autoupdate: 1

  event :view_product do
    observe :popular_products, data[:name]
    observe :popular_prices, data[:price]
    incr :product_views_per_second
  end
end
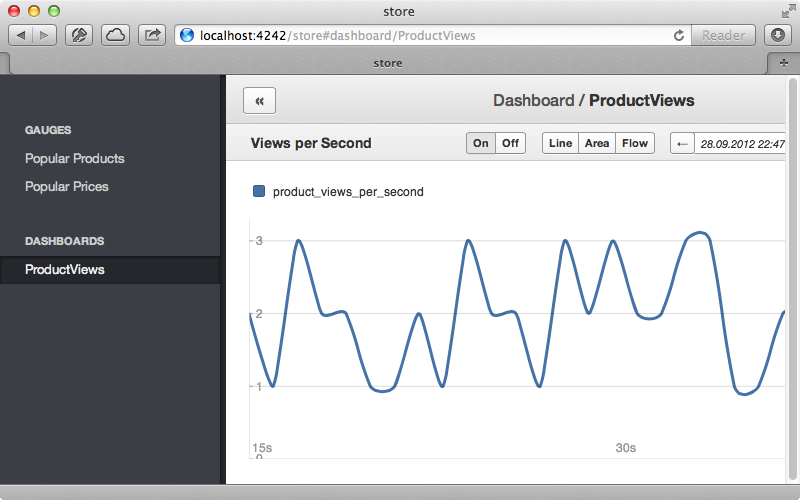
This will create a generic gauge that updates once a second. When we create a gauge like this we usually add a widget too to define how it’s displayed. We want to update this gauge whenever we receive a view_product event so we use incr to increment the gauge when this happens. When we stop and start our script now we’ll see the product views widget which automatically updates every time a product is viewed.
That’s it for our look at FnordMetric. If you want to track events in your Rails applications it’s well worth considering, although it is currently rather lacking in documentation.


