#369 Client-Side Performance pro
- Download:
- source codeProject Files in Zip (63.5 KB)
- mp4Full Size H.264 Video (35.4 MB)
- m4vSmaller H.264 Video (19.7 MB)
- webmFull Size VP8 Video (22.1 MB)
- ogvFull Size Theora Video (52.5 MB)
In the previous episode we used MiniProfiler to find the slow portions of a Rails application and optimize them. Improving the performance of the code on the server is only half the battle, however, much of what makes a web page feel slow can be on the client side in the loading and parsing of the resources. In this episode we’ll show you several tools for analyzing what’s going on in the browser and give you some tips on how to improve performance so that your site will feel even faster.
We’ll demonstrate this using the Railscasts site. Our goal is to determine what goes on when its home page loads and what we can do to improve its performance. We’ll use Google Chrome to do this as it has useful developer tools for analyzing a web page. The first thing we’ll look at is the network tab. If we click this then reload the page we’ll see a waterfall report showing what happened while the page loaded.
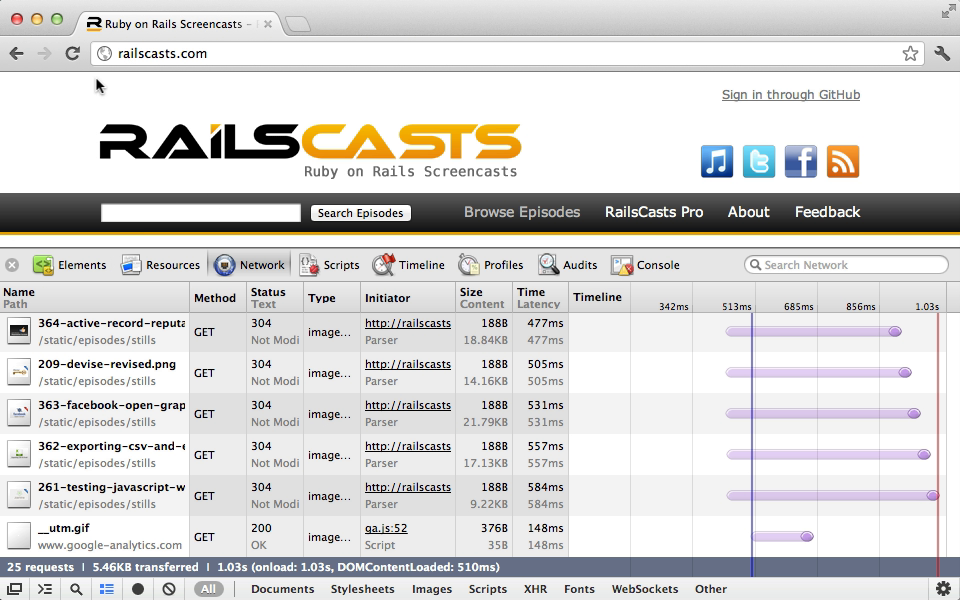
The page took just over a second to load completely and we can see the various requests here and how long each one took to process. Each bar in the timeline is made up of two parts. The first lighter section shows the time between the request being made and the response beginning while the second section shows the time spend processing the response. We can hover over any of the bars for more details about where the request spent the most time. As far as Rails is concerned this request took around 200ms to process this time and while this time could probably be improved that’s only a fraction of the total time that the page took to load. We’ll take a look at what happens during the rest of this time.
There’s more to this story than what we see here. If we hover over a lot of the bars the darker section shows 0ms and this is because Chrome is reading files from the cache instead of using the full response from the server. This means that we’re not getting an accurate representation of the performance that someone coming to the site for the first time will experience. This is even more obvious if we visit this page by clicking a link to it instead of reloading it. If we do this most of the page’s assets will be fetched from the cache without making a request to the server.
It’s useful to see how caching affects performance but if we want to get the perspective of a first-time visitor we can turn off caching in the developer tools’ settings. If we do this then reload the page again the cache won’t be used. This time the page takes around 1.3 seconds to load and the dark sections of the bars are longer as everything is loaded in from the server.
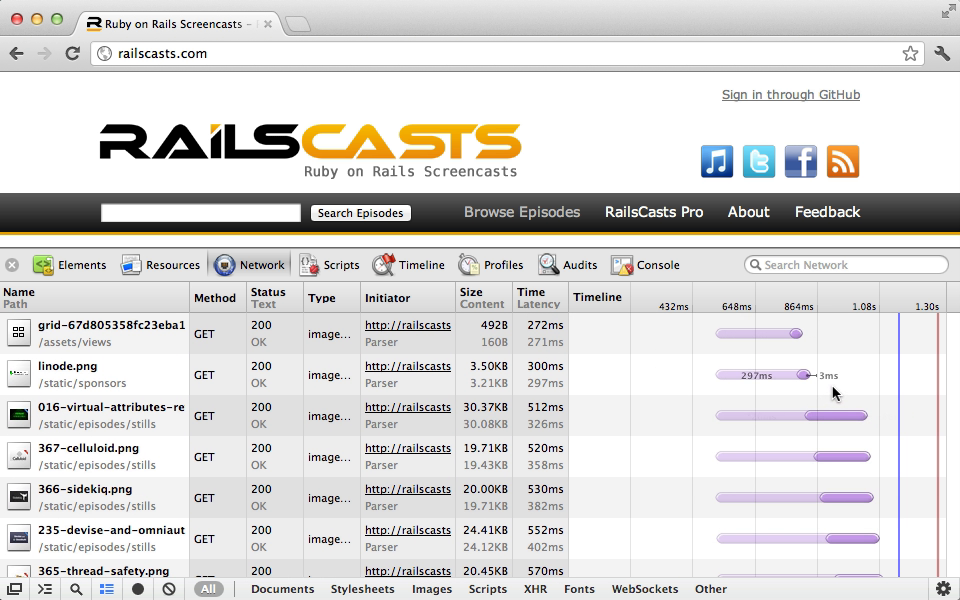
There are several ways that we can analyze this output to help us improve the page’s performance, but before we do that we’ll show another way to generate a waterfall report without using Chrome. On the WebPageTest site we can enter a URL and specify a location and browser and the site will tell us how the page loads for those settings. We can even customize other settings such the connection speed. The test make take a minute or so to run but once it completes we’ll see the results. The test loads the page twice. In this case the first view took around 2.5 seconds while the second took around 1.2 seconds thanks to caching. There are also waterfall graphs for each load along with a screenshot.
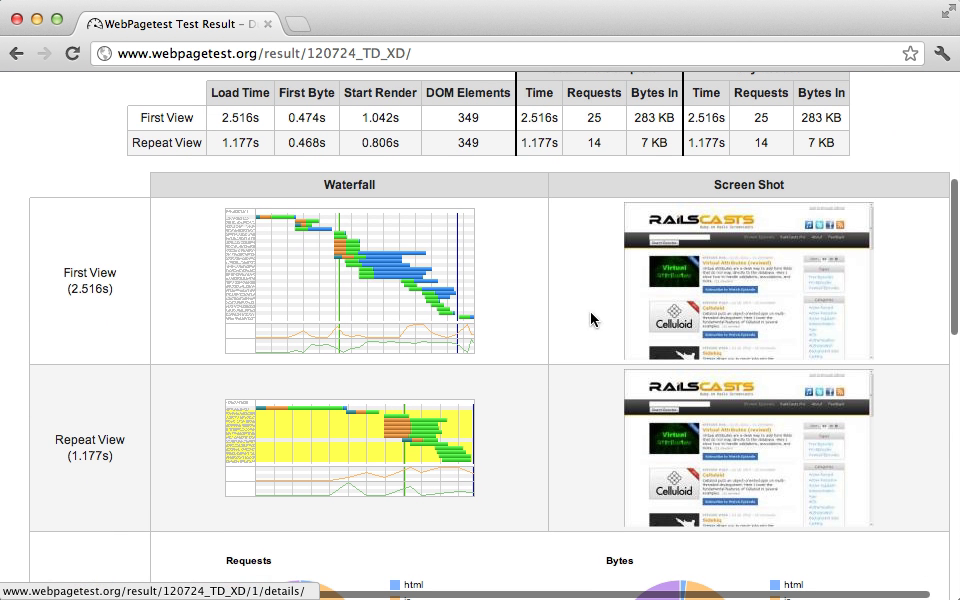
If we click on the first waterfall graph we’ll be taken to a page similar to the graph we saw in Chrome. WebPageTest does more than just this, though, it also grades our application in a variety of areas. The Railscasts site does well in all areas apart from caching static content so lets take a look at that. We can click on the area that has scored badly to get more details about why it has done so and when we do it turns out that a lot of the images on the page don’t have a Max-Age or Expires header in their response. This is something that the asset pipeline helps us with but we aren’t using it for all the images. To fix this we could configure the web server to add an Expires header for these images. To learn more about HTTP caching and how response headers work take a look at episode 321.There’s much more information in the test results about each request and whether they pass certain tests.
There are other tools that give this kind of information and one of these is available within Chrome’s Developer Tools. If we click the “Audits” icon then reload the page we want to analyze we’ll be given several suggestions as to how we can improve the page’s performance, including the one we saw earlier about using browser caching.
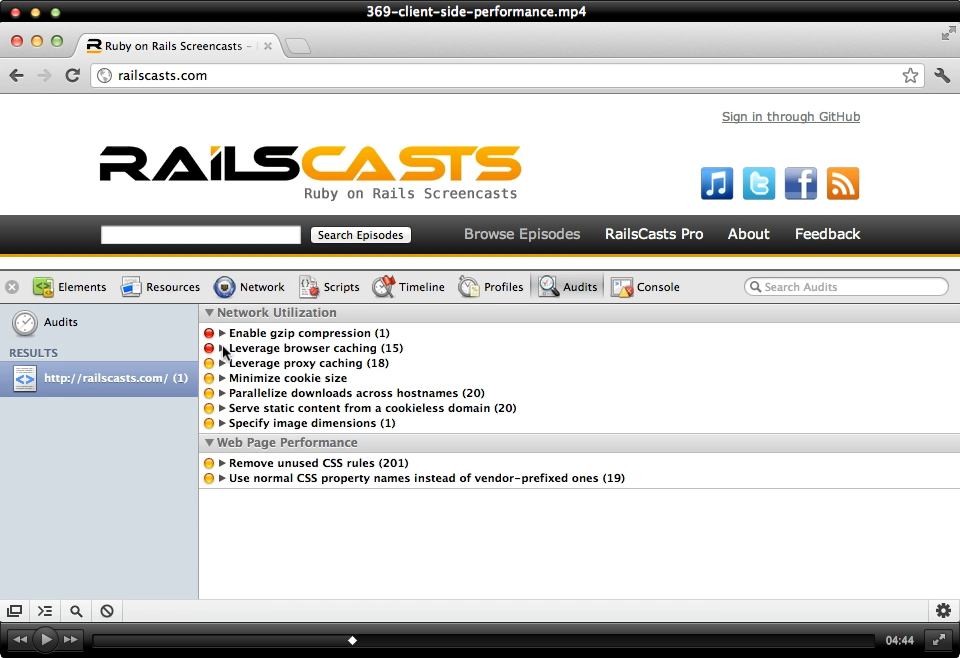
This tool also suggests that we move some of the assets to different domain names so that their downloading can be done in parallel by opening more connections. On a similar note if we move the static assets to a domain which doesn’t match the cookies then the client won’t send the cookies for each request to the static assets. This is more critical is we have a lot of large cookies matching the domain.
The tool also warns us about images that don’t have their width and height specified in the HTML. Fixing this will make the layout more consistent while the page loads. Another useful feature it has is the ability to find the CSS rules that aren’t used on the page. Unless they’re used elsewhere we should consider removing these to reduce the size of our application’s stylesheets. Episode 180 covers this is more detail.
That’s it for the audit tool but there are other tools that we can use to analyze our page. One of these is Google’s PageSpeed Insights. This can be used online or as a browser extension. We’ll install the extension for Chrome; Once we’ve done so the best way to use it is in the Developer Tools. There’ll be a new PageSpeed button on its toolbar and if we click it it will analyze the current page and generate a report. Some of the things mentioned in this report are the same as we’ve seen in other tools but there are other suggestions listed such as combining images into CSS sprites. The report even lists the images that we should be combining. Each the suggestions this tool makes links to a page that has more information about that optimization, why we should use it and the tools we can use to implement it. Episode 334 has more information on CSS sprites.
PageSpeed also gives us tips on optimizing images. A number of images on the page can be compressed further without any loss in quality and PageSpeed will list these, along with a indication of how by how much the image can be reduced in file size. There’s even a link to the compressed version of the image.
Optimizing How JavaScript Loads
PageSpeed is a very useful tool and is well worth using with your web sites to see how they can be optimized. One last suggestion it makes that we’ll look at is deferring the parsing of JavaScript. We haven’t looked at the application’s JavaScript much yet but we can do a lot to optimize it and this plays a critical part in how fast a page feels. Before tackling this issue it helps to get a better understanding of how JavaScript is loaded in. When the page loads the other resources are prevented from loading while the JavaScript loads. Even worse the rendering of the HTML stops at this point as well so the user will see a blank screen until the JavaScript has finished loading. We’ll demonstrate this problem in a simple Rails app that’s designed to manage projects and tasks.
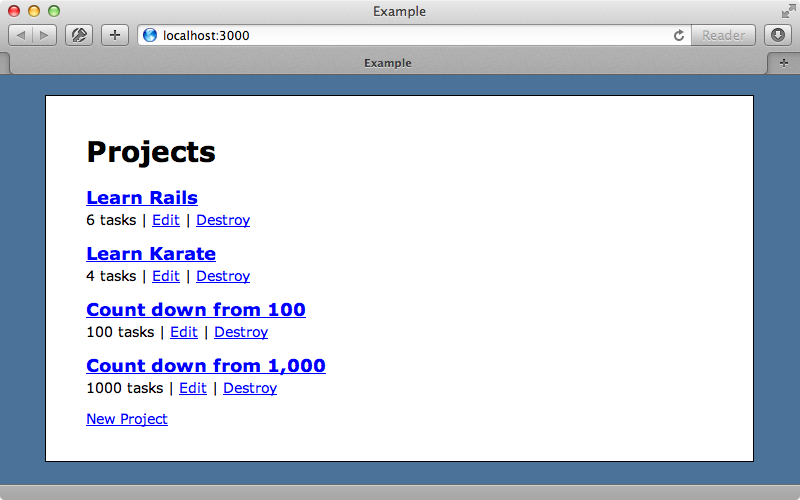
We include this application’s JavaScript in its layout file.
<head>
  <title>Example</title>
  <%= stylesheet_link_tag "application", media: "all" %>
  <%= javascript_include_tag "application" %>
  <%= csrf_meta_tag %>
</head>
We’ll find code like this in a lot of Rails applications. The problem with this approach is that everything stops rendering while the JavaScript loads. To demonstrate this we’ll change the javascript_include_tag to point to an action that sleeps for two seconds.
<head>
  <title>Example</title>
  <%= stylesheet_link_tag "application", media: "all" %>
  <%= javascript_include_tag "/sleep" %>
  <%= csrf_meta_tag %>
</head>
When we reload the page now there’s a two second pause before the page renders. If we load the page in Chrome with the Network we’ll see that we don’t see anything on the page until the slow-loading JavaScript file completes loading.
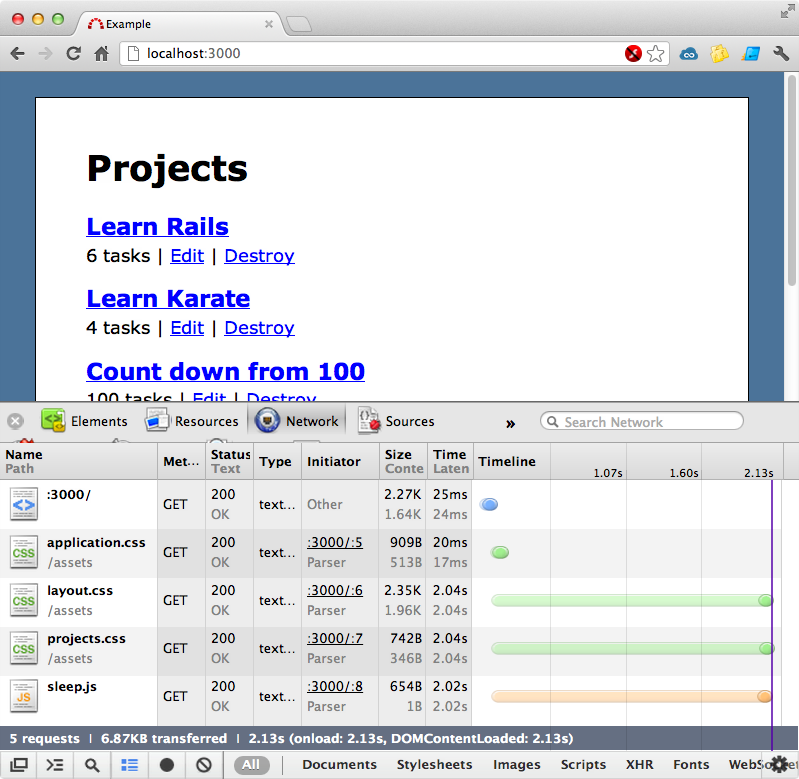
In a real application no JavaScript file should take this long but even a 200ms delay can have an impact on how fast a site feels. There are several solutions to this problem. One is to move the JavaScript out of the head section and to place it at the bottom of the page’s body. This way it won’t block the rendering of the page.
<body>
  <div id="container">
    <% flash.each do |name, msg| %>
      <%= content_tag :div, msg, id: "flash_#{name}" %>
    <% end %>
    <%= yield %>
  </div>
  <%= javascript_include_tag "/sleep" %>
</body>
When we reload the page now it renders instantly even through the JavaScript still takes two seconds to load. Alternatively we can load the JavaScript asynchronously. To do this reliably across all browsers is a little messy as we need to replace the javascript_include_tag in the layout with this.
<script type="text/javascript">
  (function() {
    var script = document.createElement('script');
    script.type = 'text/javascript';
    script.async = true;
    script.src = '<%= j javascript_path("/sleep") %>';
    var other = document.getElementsByTagName('script')[0];
    other.parentNode.insertBefore(script, other);
  })();
</script>
This is an inline script that inserts another script tag for the JavaScript that we want to load in and loads it asynchronously so that the rest of the page isn’t blocked. To demonstrate this we’ll remove the javascript_include_tag from the end of body and put this new code in the head section. When we reload the page now the view renders almost instantly, even though the JavaScript is taking two seconds to load as it’s done asynchronously. Now that we have this working we can replace the sleep action with our application’s actual JavaScript file so that loading the JavaScript won’t block the rendering.
script.src = '<%= j javascript_path("application") %>';When we do this we need to watch out for other JavaScript files that exist. If they rely on jQuery then we’ll have a problem as we won’t know when jQuery will be available and fully loaded given that it happens asynchronously. When possible we should move scripts into the asset pipeline so that they’re all loaded within the application.js file. There are also tools that can help with these dependency issues, such as RequireJS.
Another thing to watch our for when loading JavaScript asynchronously is the increased chance that a user might do something on the page that requires JavaScript before the scripts have fully loaded. For example the “Destroy” links on our page require JavaScript to work correctly. We should change this behaviour so that it degrades gracefully like we showed in episode 77.
The code that loads the script asynchronously looks fairly messy in the layout file so it would be best to move it out into a partial. The important part of this code, the path to the JavaScript file, is rather hidden amongst the rest of it and moving it into a partial would help to emphasise it again.
<%= render "layouts/async_javascript", path: "application" %>Our new partial file looks like this:
<script type="text/javascript">
  (function() {
    var script = document.createElement('script');
    script.type = 'text/javascript';
    script.async = true;
    script.src = '<%= j javascript_path(path) %>';
    var other = document.getElementsByTagName('script')[0];
    other.parentNode.insertBefore(script, other);
  })();
</script>
JavaScript Performance
We’ll finish off this episode by looking at JavaScript performance and profiling. If we go to a specific project on our site we’ll see a list of tasks that we can check off. When we check off a task it instantly moves to the completed tasks list and the application has some JavaScript which makes an AJAX call to achieve this.
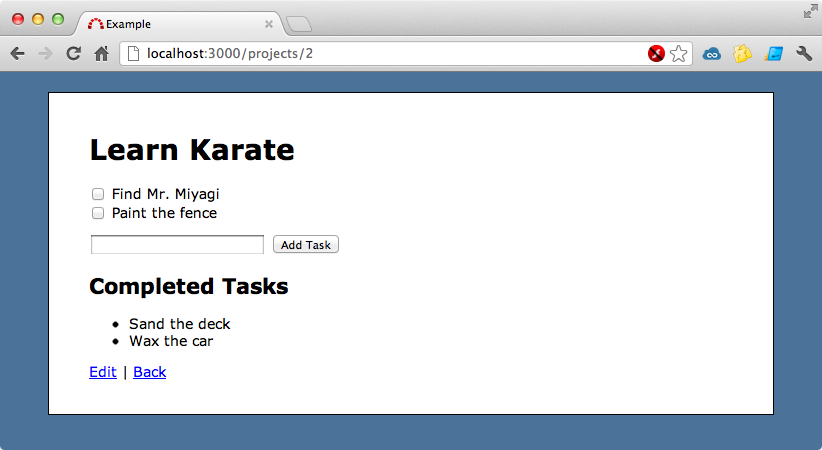
We’ll take a look at some of the JavaScript, specifically this code below.
jQuery ->
  $('#tasks input[type=checkbox]').click ->
      $(this.form).submit()
      true
This code listens to each checkbox’s click event and when this fires the form that the checkbox is on is submitted. As the form is marked as remote this triggers the AJAX functionality. If we had a thousand tasks we’d want to improve the JavaScript performance for this scenario so we’ll do some profiling to see how it performs. There are several profiling tools and one of them is available within Chrome’s developer tools. We just need to click the “Profile” tab, select “Collect JavaScript CPU Profile”, click “Start”, reload the page and then click “Stop” when it finishes loading.
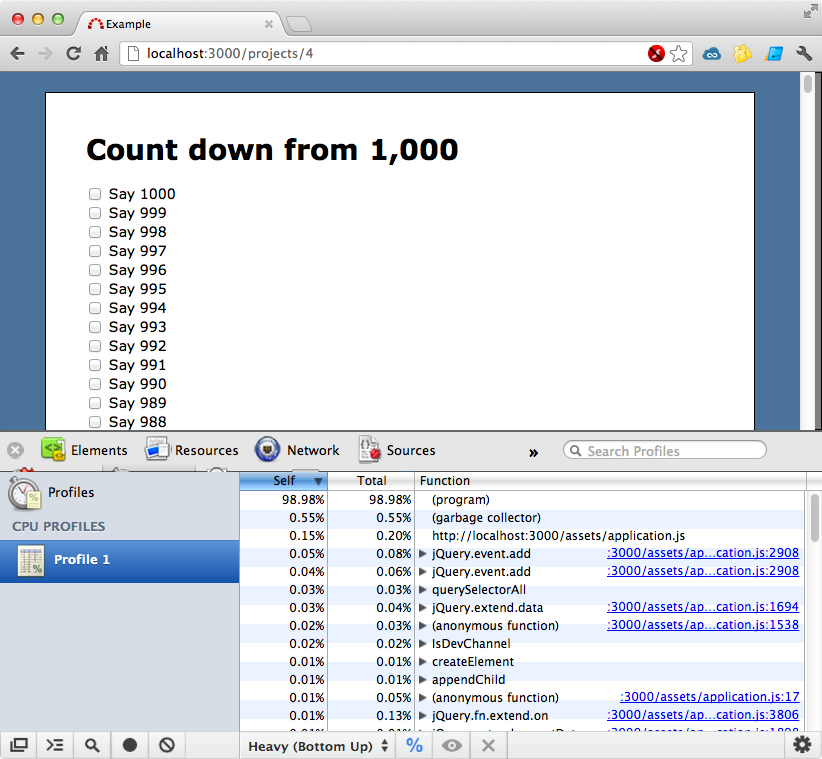
This bottom-up view tells us which parts of the JavaScript took the longest time to run. If we instead select the top-down view we can drill down to see the calls that were made. By default the time taken is shown as a percentage but we can change this to see the absolute time. The jQuery.extend.ready callback which triggers the code we showed earlier takes around 31ms. This isn’t too bad but we can probably reduce it. Instead of manually triggering the profiler we’ll trigger it in code. This is done by calling console.profile and passing in a name to start profiling and then calling console.profileEnd to stop profiling.
jQuery ->
  console.profile("Task checkboxes")
  $('#tasks input[type=checkbox]').click ->
      $(this.form).submit()
      true
  console.profileEnd();
Now we don’t even have to start the profiler. If we reload the page it will now insert a profile entry automatically. This shows this code taking 22ms to run this time and what’s nice about this approach is that it isolates just the code we’re interested in. With this focussed profiling in place we can experiment with performance. Instead of listening to the checkboxes’ click event we’ll use on, like this:
jQuery ->
  console.profile("Task checkboxes")
  $('#tasks').on 'click', 'input[type=checkbox]' ->
      $(this.form).submit()
      true
  console.profileEnd();
When we reload the page now it will run the profiler again and now this piece of code only takes 2ms to process. This seems to be much faster but it might just be deferring the time until the click event happens.
To help us to work this out we can use another tool for analyzing performance called Speed Tracer. This is another Chrome extension and once we’ve installed it we’ll have a button in the toolbar that we can click to start it recording. Once it’s running we’ll click one of the checkboxes on the page then click it again to stop it. We can now see all the events that took place while Speed Tracer was running. One of these was the click event and Speed Tracer will show us the details of what happened for this event.
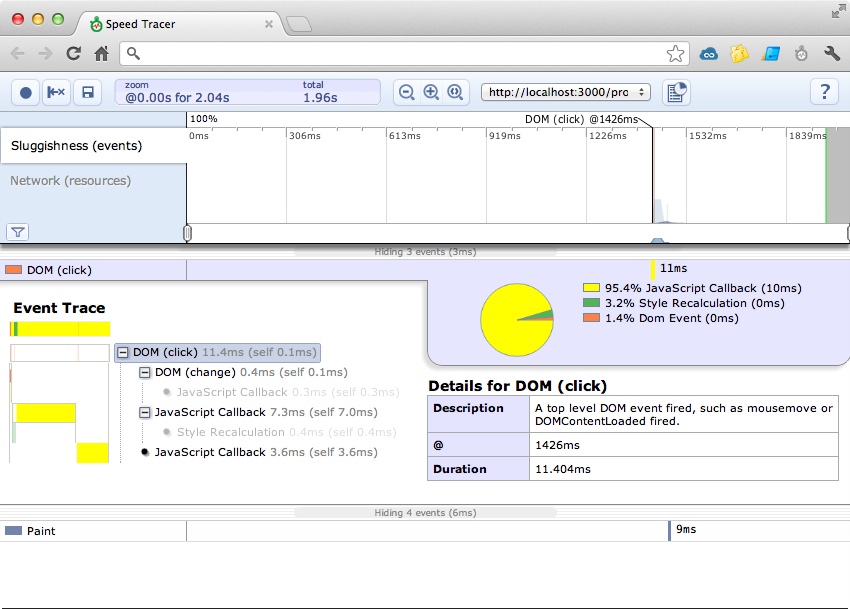
The time shown here to do the JavaScript callback is fast. Comparisons with the click function in jQuery show that the times are quite similar so there doesn’t appear to be much difference in time between the two ways of wiring up the click event in this application.


