#368 MiniProfiler
- Download:
- source codeProject Files in Zip (203 KB)
- mp4Full Size H.264 Video (33 MB)
- m4vSmaller H.264 Video (13.3 MB)
- webmFull Size VP8 Video (13.2 MB)
- ogvFull Size Theora Video (33.8 MB)
Let’s say that we’re working on a Rails application that’s starting to feel a little slow. Obviously we want to optimize its performance but before we start to do so it’s best to run a profiling tool so that we can find the bottlenecks. There are many profiling tools available but in this episode we’ll look at MiniProfiler. This was originally created for .Net development but has recently been ported to Ruby and is a great tool for profiling Rails applications. Adding MiniProfiler to an application is easy. All we need to do is add the gem to our gemfile and run bundle to install it.
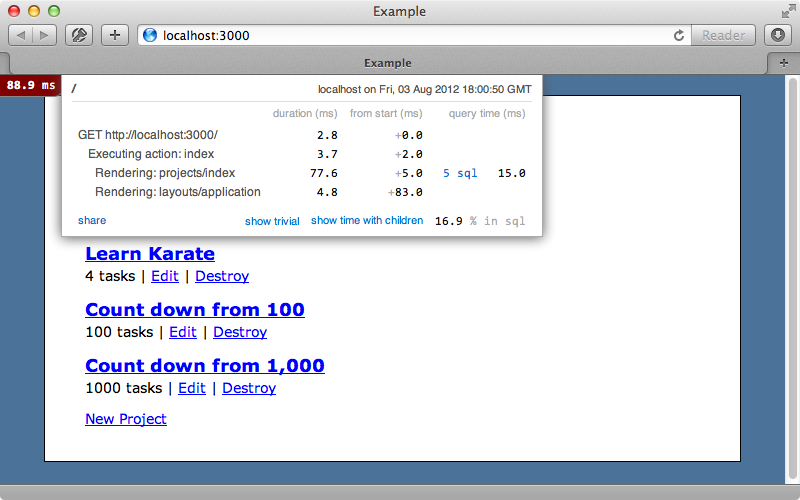
gem 'rack-mini-profiler'After restarting our application and loading one of its pages we’ll see that MiniProfiler is enabled by default in development mode. The time that the page took to load is displayed in the top left corner and clicking this will show us a more detailed breakdown of how much time was spent in each part of our application.

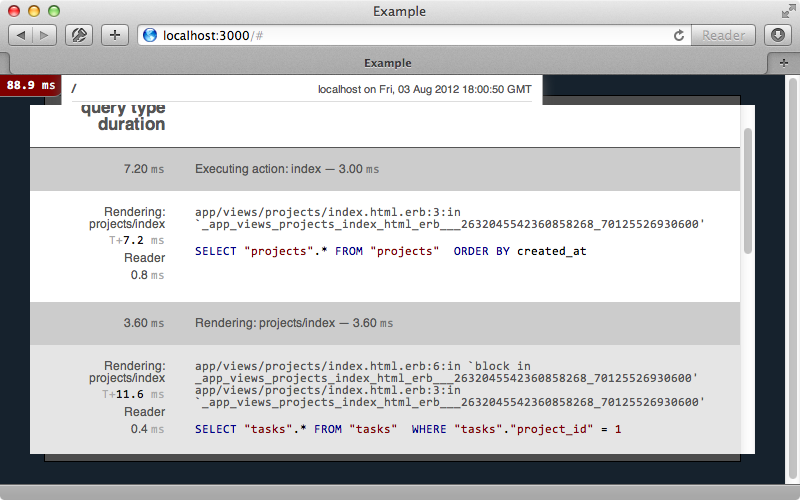
Here we can see the time taken in the controller and that rendering this index action took most of the time, mostly likely because it had to execute 5 SQL queries due to lazy loading. If we click on the SQL link we’ll be shown exactly which SQL queries were run along with a stack trace for each one.

This shows us that a full SELECT query is being performed here to fetch all the contents for each task that belong to each project. One the page itself we only display the number of tasks that each project has so we’re fetching more data from the database than we need to. If we look at the template that’s being rendered we’ll see the code that renders the number of tasks.
<%= pluralize project.tasks.length, "task" %>Calling project.tasks.length isn’t an efficient way to get the count as it fetches all the task data from the database so we’ll use tasks.size instead.
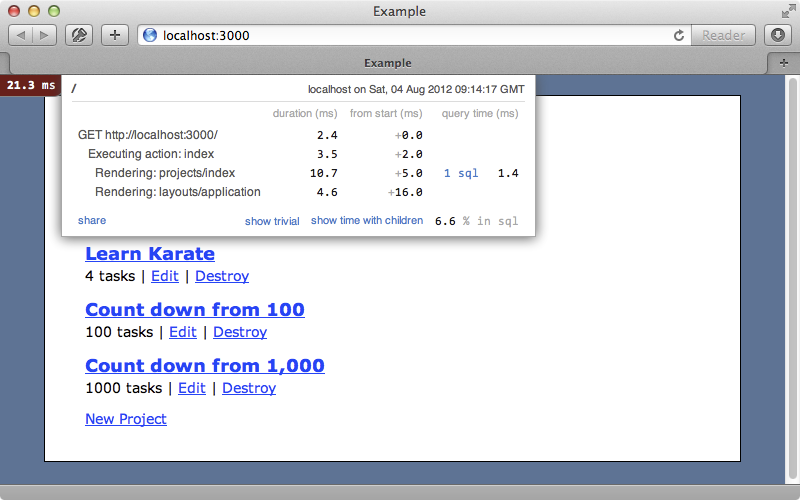
<%= pluralize project.tasks.size, "task" %>When we reload the page now MiniProfiler shows a smaller number as much less data is fetched from the database. Instead of getting all the data related to a project’s tasks we’re just getting a count which takes less time to run. That said we’re still performing five SQL queries for this page and this number will only increase as we add more products. There is a way to reduce the number of queries to one but we’ll have to write some SQL. We’ll do this in the ProjectsController’s index action but if this was a production app this code should go in the model.
def index
  @projects = Project.order(:created_at).select("projects.*, count(tasks.id) as tasks_count").joins("left outer join tasks on project_id = projects.id").group("projects.id")
end
We need to fetch more than projects columns here so we also fetch the count for the tasks. We’ve called this column tasks_count and this name is important as tasks.size will use this value instead of having to perform a second query. We need to join the tasks association but using joins(:tasks) isn’t the best way to do this as this will perform an inner join and therefore miss any projects without tasks. We’ve written a SQL fragment to perform a left outer join instead. This query isn’t the prettiest thing but our page loads more quickly now and MiniProfiler now shows that we’re only running one SQL query to get the page’s data.

The SQL query takes around a millisecond to run now but it takes some time for ActiveRecord to instantiate objects. MiniProfiler gives us a method for measuring how long a specific piece of code takes to run and we can use this in our controller. We can call Rack::MiniProfiler.step and pass it a description and a block. The time taken to process the block will show up in the report. The projects are lazy-loaded in this action and are actually loaded by the view so we’ll call @projects.all in the block to load them.
def index
  @projects = Project.order(:created_at).select("projects.*, count(tasks.id) as tasks_count").joins("left outer join tasks on project_id = projects.id").group("projects.id")
  Rack::MiniProfiler.step("fetch projects") do
     @projects.all
  end
end
If we reload the page now we’ll see the time it took to load the projects.

This approach is useful if we ever find ourselves needing to measure something specific. The next step in optimizing this query would be to add a counter cache column but we won’t do that here. Episode 23 covers doing this in detail.
Running Our App in Production Mode
So far we’ve been profiling the development environment and this can lead to slower times that we’d get for the same application in production. If we’re performing extensive profiling of an application it’s better to do it in the production environment. It can be a little tricky to run a Rails application in production on a development machine but we’ll walk through the steps here. First we need to change the serve_static_assets option in our production config file to true.
# Disable Rails's static asset server (Apache or nginx will already do this)
config.serve_static_assets = true
Alternatively we could set up a separate staging environment like we did in episode 72. Next we’ll need to generate our application’s assets and set up the database for the production environment. We can then start up the server in production.
$ rake assets:precompile
$ rake db:setup RAILS_ENV=production
$ rails s -e production
When we reload the page now our app is running in the production environment. The MiniProfiler time will have disappeared, however, as it doesn’t show by default in production. It’s easy to restore it by adding a before_filter to our ApplicationController.
class ApplicationController < ActionController::Base
  protect_from_forgery

  before_filter :miniprofiler

  private
  def miniprofiler
    Rack::MiniProfiler.authorize_request
  end
end
One useful side-effect of this approach is that it allows us to change this behaviour depending on the current user so that the profiler only appears if the user is, say, an admin.
We need to restart our application every time we make a change in production mode. Once we’ve done this and we reload the page the profiler should appear again. When we deploy our application the profiler results will probably be different as the production hardware will be different from the machine we’re developing the application on so for the most accurate results its best to profile as close a possible to the production environment. Even on the development machine it’s best to focus on how much the load time for a page can be reduced instead of the absolute amount that a page takes to load. If we can improve a page in development then it will more than likely be improved in the production environment too.
More Features
We’ll finish off this episode with a look at a few more of MiniProfiler’s features. One useful one is the way that it handles redirects. If we edit a product then click “update” we’ll get two profiler figures, one for the update action and one for show. This means that we can see results for actions that perform redirects. Another useful feature is the ability to customize MiniProfiler on a per-request basis by passing in a querystring parameter. Adding a pp=help parameter will give us a list of the options we can use here and these are listed below.
Append the following to your query string:

  pp=help : display this screen
  pp=env : display the rack environment
  pp=skip : skip mini profiler for this request
  pp=no-backtrace : don't collect stack traces from all the SQL executed
  pp=full-backtrace : enable full backtrace for SQL executed
  pp=sample : sample stack traces and return a report isolating heavy usage (requires the stacktrace gem)
There are options here for viewing Rack environment variables, configuring the backtrace for the SQL results and a sample option which return a callstack. For further documentation you should read a blog post by Sam Saffron who maintains this gem. There he goes into detail on profiling and ActiveRecord queries and show some other interesting features such as specifying a method that we want to profile in an initializer method to add it to the list of results. It’s also worth reading the gem’s README file which contains documentation on other things including the storage engine. This defaults to a file store but we can use Redis which is useful if we have multiple servers running our application.


